Chrome DevTools MCP: Give Your AI Agent a Real Browser
AI coding agents are getting browsers. Not simulated ones — real Chrome, with full DevTools access.
Google just shipped Chrome DevTools MCP, an official Model Context Protocol server that gives any AI coding agent (Claude Code, Cursor, Copilot, Gemini CLI, Codex, and more) the ability to control and inspect a live Chrome browser. And because it’s built on the actual Chrome DevTools Protocol, you get the real thing: performance traces, source-mapped stack traces, network inspection, Lighthouse audits — not just click automation.
I wired it up and tested it. Here’s what happened.
What Is It?
The Chrome DevTools MCP (chrome-devtools-mcp on npm) is an MCP server maintained by the ChromeDevTools GitHub org — Google’s own team. It bridges MCP clients to Chrome’s DevTools Protocol via Puppeteer under the hood, exposing a clean set of tools your AI agent can call like any other function.
The result: your agent stops guessing what’s on a page and starts seeing it, the same way a developer does with DevTools open.
What It Can Do
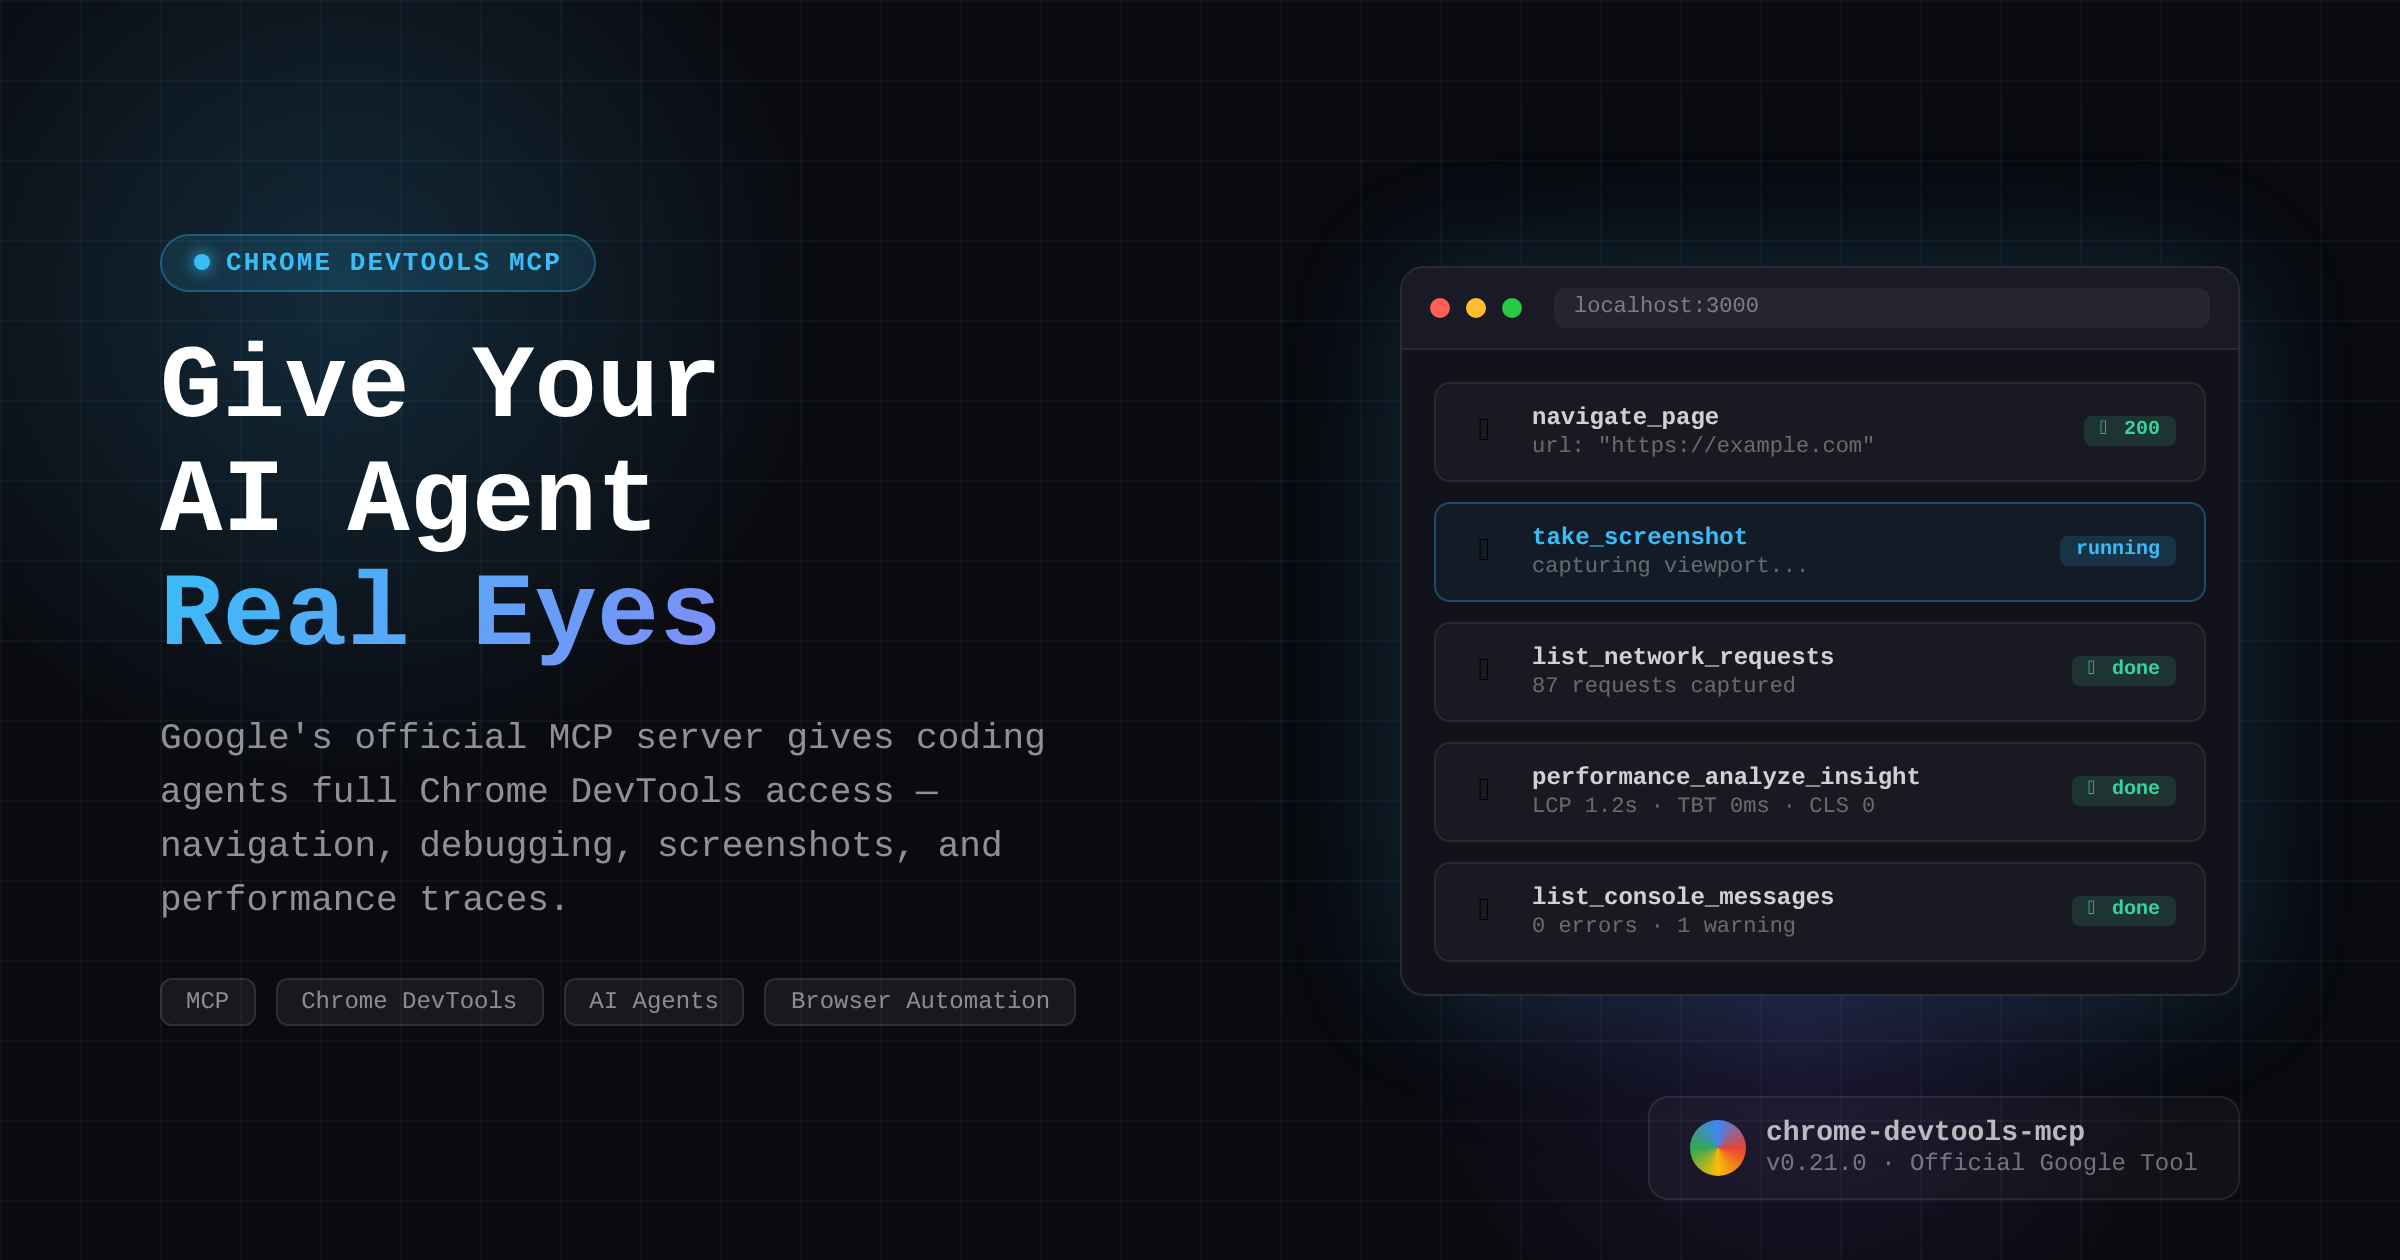
Out of the box you get 29 tools across six categories:
Input automation — click, fill, drag, type_text, upload_file, press_key, handle_dialog, fill_form (9 tools)
Navigation — navigate_page, new_page, close_page, list_pages, select_page, wait_for (6 tools)
Debugging — take_screenshot, take_snapshot (full DOM tree with element UIDs), evaluate_script, list_console_messages, get_console_message, lighthouse_audit (6 tools)
Network — list_network_requests, get_network_request — every request, status code, and response (2 tools)
Performance — performance_start_trace, performance_stop_trace, performance_analyze_insight, take_memory_snapshot (4 tools)
Emulation — emulate (network throttling, CPU throttle, viewport, dark mode, geolocation), resize_page (2 tools)
Setting It Up (Two Minutes)
The quickest path is connecting to an existing Chrome instance via remote debugging:
Step 1: Launch Chrome with remote debugging enabled:
# Linux/headless server
chromium --remote-debugging-port=9222 \
  --user-data-dir=/tmp/chrome-profile \
  --headless=new \
  --no-sandbox \
  --disable-gpu &
Step 2: Verify it’s running:
curl http://localhost:9222/json/version
# Returns: { "Browser": "Chrome/147...", "webSocketDebuggerUrl": "ws://..." }
Step 3: Add to your MCP client config:
{
  "mcpServers": {
    "chrome-devtools": {
      "command": "npx",
      "args": [
        "-y", "chrome-devtools-mcp@latest",
        "--browser-url=http://127.0.0.1:9222",
        "--no-usage-statistics"
      ]
    }
  }
}
That’s it. No API keys, no accounts, no proprietary SDKs. It’s just npx.
What I Actually Found Testing It
I ran a full test session against live pages. Some things stood out:
The DOM snapshot is remarkably agent-friendly. take_snapshot returns a structured accessibility tree with stable uid attributes for every interactive element. Your agent gets uid=1_42 button "Submit" — no fragile CSS selectors, no XPath gymnastics. It’s the same representation screen readers use, which makes it robust against style changes.
Console messages catch real errors. When I navigated to a broken URL, the MCP immediately surfaced: [error] Failed to load resource: 404, a form field accessibility warning, and a custom element error — exactly what you’d see in DevTools, without opening the browser.
Network inspection is complete. Navigating to a single page captured 87 network requests: fonts, CSS, JavaScript bundles, API calls — each with method, URL, and status code. For an AI agent debugging a slow page or a failed API call, this is the difference between guessing and knowing.
Performance traces work as advertised. performance_start_trace / performance_stop_trace wraps Chrome’s actual tracing infrastructure. Combined with performance_analyze_insight, the agent gets actionable summaries rather than raw JSON dumps.
The screenshot is a real image. Not a text description — a PNG, base64-encoded, returned directly in the MCP response. The agent can analyze it with a vision model or save it as evidence. At 2x device pixel ratio it’s sharp enough to read fine print.
JavaScript eval gives you everything else. evaluate_script runs arbitrary JS in the page context and returns JSON-serializable results. document.title, computed styles, localStorage state, API response bodies — anything DevTools can touch, your agent can read.
Why This Matters for AI Agents
Most browser automation agents today work through one of two approaches: a text-based accessibility tree (fast but incomplete), or full screenshot + vision model inference (complete but expensive and slow). Chrome DevTools MCP gives you both simultaneously — the structured DOM for precise actions, plus screenshots for visual verification, plus network and console data for debugging.
The other thing worth noting: this is the official tool from Google’s own DevTools team. It tracks the latest stable Chrome, and the codebase has explicit support for every major coding agent — Claude Code, Cursor, VS Code Copilot, Gemini CLI, Codex, Cline, Windsurf, and more. This isn’t an experiment; it’s infrastructure.
A Note on Privacy
The MCP server has access to everything in the browser it connects to. Don’t point it at a profile where you’re logged into anything sensitive. The --isolated flag creates a fresh throwaway profile that gets wiped when the session ends — use that for anything public-facing. Also, usage statistics are collected by default; pass --no-usage-statistics to opt out.
The Bigger Picture
When Andrej Karpathy coined “vibe coding” — prompting, accepting, tweaking, repeat — the browser was still a blind spot. Agents could generate code that touched the DOM but couldn’t see what they’d built. Chrome DevTools MCP closes that loop.
Your agent can now:
- Generate a component
- Navigate to localhost to see it rendered
- Inspect the DOM to verify the structure
- Check the console for errors
- Run a Lighthouse audit to catch performance issues
- Screenshot it to confirm the visual
That’s a complete development feedback loop — no human in the middle.
The GUI was always a read-only surface for AI agents. That’s changing fast.
Links:
- GitHub: ChromeDevTools/chrome-devtools-mcp
- npm: chrome-devtools-mcp
- Official announcement: Chrome for Developers Blog